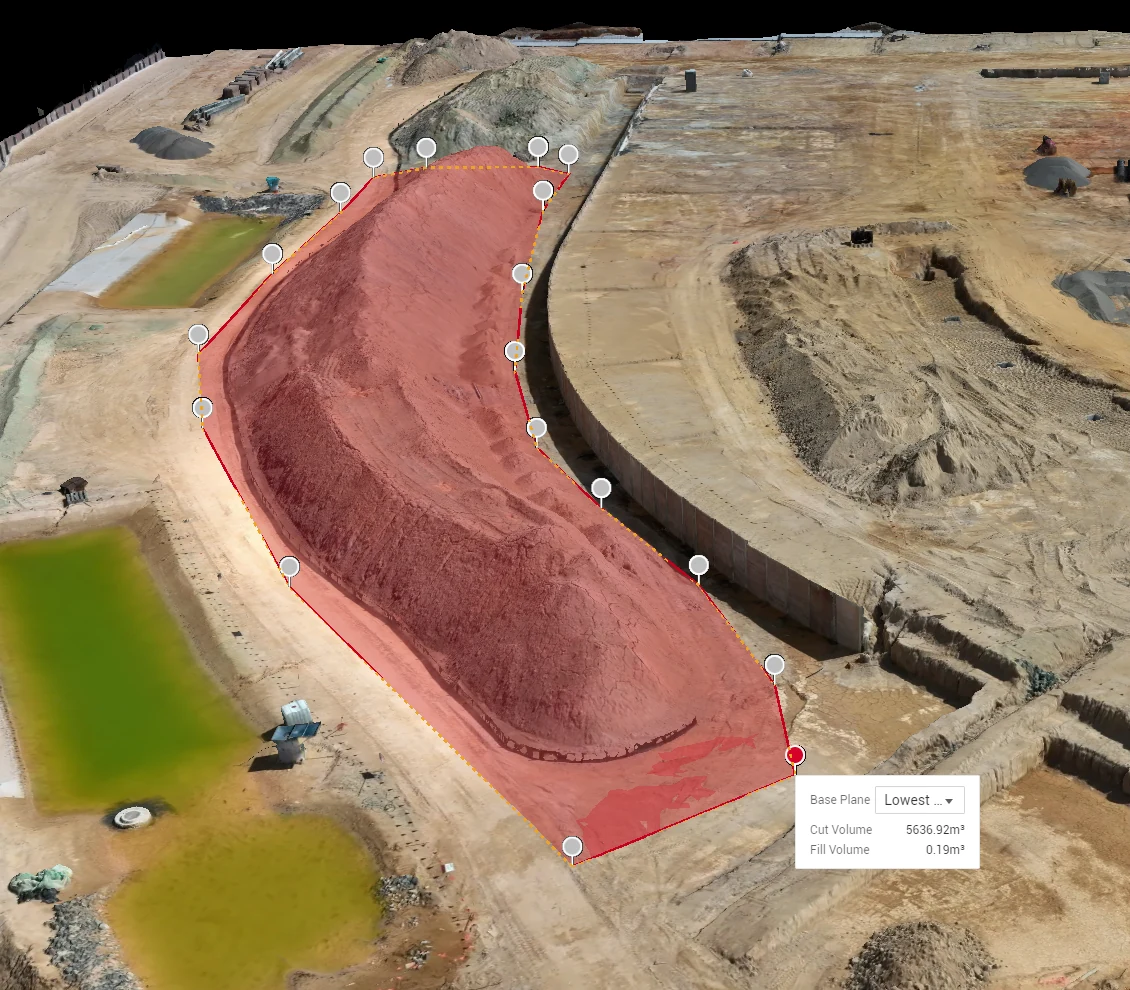
Where volumetric error comes from
A volume is one surface subtracted from another. Every source of error in a drone volumetric survey is an error in one of those two surfaces, which makes the question easier to pin down than a bare percentage suggests.
| Error source | What it does to the volume | What controls it |
|---|---|---|
| Camera position error | Shifts or warps the whole surface | RTK positioning against a base station, and ground control points measured independently |
| Sparse surface detail | Rounds off crests and toes, smoothing volume away | Ground sample distance: how many centimetres each pixel covers |
| Base surface definition | Often the largest practical error on a site | How the toe of the pile is defined, and whether the same base is reused between surveys |
| Overhangs and bunker walls | Photogrammetry cannot see under an overhang | Flight design, oblique capture, and stating where the method stops |
A volumetric accuracy figure that does not say how those four are controlled is a brochure number. The ones below come from a report.
Real figures from a Survey Quality Report
Every survey and model delivery ships with a Survey Quality Report, so your engineer reads the residuals instead of assuming them. These are the figures from the report on a topographic demonstration flight over a Redland Bay development site, run on the same workflow a volumetric survey uses, a demonstration rather than a client engagement, published because the numbers are the point:
- 2,345 images captured, 2,345 calibrated. Every image aligned.
- RTK status: Fix on every image. Not one frame fell back to float or single positioning.
- Average RTK positional standard deviation: 0.351 cm horizontal, 0.707 cm in elevation per image against the base station.
- Ground sample distance: 0.911 cm per pixel from an average flight height of 33 m, so every pixel on the ground surface covers less than a centimetre.
- 410,832 tie points, reprojection error 0.854 px. The internal geometry of the reconstruction closes tightly.
Those figures describe the positioning layer of a demonstration flight. On a client survey two further layers sit on top: independently measured ground control points constrain the model to survey marks, and check points withheld from the bundle adjustment test the finished surface against marks it never used. The residuals at those check points go in the report you receive. The method behind the figures is set out under drone topographic surveys.
The accuracy gate, in writing
The gate is set per job and stated in the proposal before capture, with the capability figures of up to 1 cm + 1 ppm horizontal and 1.5 cm + 1 ppm vertical under RTK with ground-control validation. If the delivered data does not meet it, ground control is re-marked and the aerotriangulation re-run; if it still falls short, the site is re-flown at no cost. That sentence is in our proposals because a volumetric figure you cannot defend at audit is worth nothing.
The base surface decides the number
Two operators can fly the same pile with the same drone and report different volumes, and the difference is usually the base. A pile sitting on a sloping pad, a pile that has been pushed into a bund, a pile whose toe has spread since the last visit: each one changes the surface the volume is measured against. On a Hover survey the base is defined once, recorded in the report and reused on every following visit. Where a pre-fill ground model exists it is used; where it does not, the base is established from the surrounding terrain and the assumption is written down. Either way the month-on-month change is a measure of material moved, not of remodelling.
Drone survey versus walking the pile
A GPS pole walked over a stockpile samples the surface at a few hundred points and interpolates everything between them. A drone survey measures it at millions. On broken, cresting or scalloped material the walked survey smooths away detail the drone surface keeps, and the walker is standing on the pile while they do it. The drone captures from standoff with no plant interaction and no site shutdown; most sites keep operating through the capture.
The ground method still has its place. Cadastral and boundary work is a registered surveyor's by law, and Hover refers it out. For volumes, the drone surface is tested against ground control every time, so the figure can stand in a dispute, a handover or an audit.
What you receive
Volumes by pile against a defined, documented base surface; the DTM/DEM and orthomosaic behind them (GeoTIFF, .LAS, contours where needed); and the Survey Quality Report with the residuals. The formats load directly into Civil 3D, 12d, Trimble Business Center and standard GIS platforms. For repeat reconciliation the same base definition is reused, so the series shows what has moved since the last claim. The service page for stockpile and volumetric surveys covers scheduling, cut and fill, and what a series looks like over a year.
What it costs
Volumetric surveys in South East Queensland typically run $500–$2,000 per visit, exclusive of GST, depending on site size, pile count and repeat frequency; the drone survey cost guide breaks the bands down, and drone surveying in Brisbane covers mobilisation across the city. A written fixed quote comes back within one business day.
Common questions
Q/01How accurate is a drone stockpile volume?
Accuracy follows the surface. With RTK Fix on every image, sub-centimetre ground sample distance and ground-control validation, the surface is measured to an accuracy gate set per job, with capability figures of up to 1 cm + 1 ppm horizontal and 1.5 cm + 1 ppm vertical. Volume accuracy then depends mostly on a consistent base surface, which is why the base is documented and reused between surveys.
Q/02Is RTK on its own enough?
No. RTK tells you where the camera was, to sub-centimetre precision; our demonstration report shows average positional standard deviations of 0.351 cm horizontal and 0.707 cm in elevation. It does not independently prove the finished surface. Ground control points and withheld check points do that, and their residuals ship in the Survey Quality Report.
Q/03Do you need the site shut down?
Almost never. Capture is flown from standoff with no plant interaction, and Hover does not fly directly over anyone outside the operation. Where exclusion zones are needed they are small and short-lived, planned with your site team in the JSA, with a SWMS where the site requires one.
Q/04How often should stockpiles be surveyed?
Monthly on active sites and wherever stock is reconciled against sales; quarterly where movement is slow; and at end of financial year. Repeat surveys reuse the same documented base, so the movement figures are real movement.
Q/05Can you survey bunkered or overhung material?
Photogrammetry cannot see under an overhang, and the report says so instead of modelling a guess. Bunker walls and part-covered piles are flagged in the deliverable with the assumption used, so the figure can be read for what it is.